July 2022 cargo volumes (776,167 TEUs) through the Port of New York & New Jersey (the Port) continued a two-year streak of consecutive record-breaking monthly volumes and also marked the ninth-busiest month of all time for cargo activity at the Port. Year to date, container volume is up 11.4% compared to the same record-breaking period in 2021. With elevated volumes and a spotlight on the international supply chain’s ability to move goods effectively in the aftermath of pandemic induced demand, the Port remains committed to identifying ways to increase efficiency and transparency to improve our customers’ experience.
The need for additional data visibility remains a priority for Port stakeholders, as evidenced by the popularity of our weekly Port Supply Chain Dashboard. We are continuously working to keep this dashboard relevant by maintaining its focus on the needs of the Port’s customers. Thanks to the support of the terminal operators and Shipping Association of New York and New Jersey, as of September 2022, we launched an updated Port Supply Chain Dashboard that includes new port wide performance metrics.
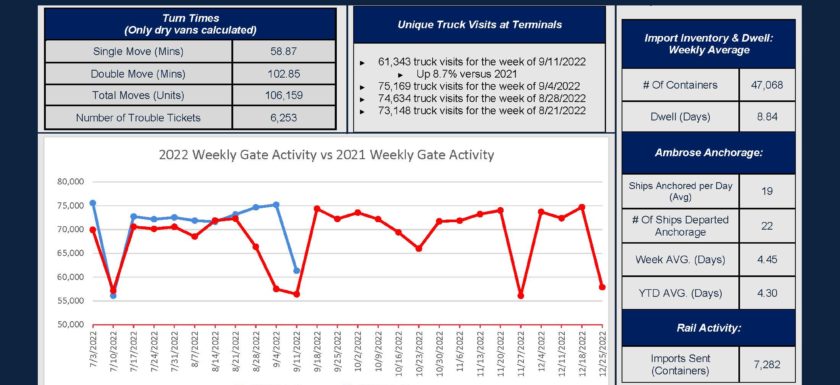
Since February of this year, The Port Authority of New York and New Jersey has been meeting on a weekly basis with the container terminal operators under the auspices of a Federal Maritime Commission Discussion Agreement. This group is focused on identifying and implementing improvements to capacity and fluidity along with increasing data sharing and transparency for the Port’s customers. To ensure relevant data metrics were being collected and disseminated, the Port Authority created a short survey to identify additional data points that customers and stakeholders wanted to see included on the Dashboard. A broad array of stakeholders including shippers, truckers, trade associations, and members of the Council on Port Performance and the Port Users Group all provided feedback on the most relevant data elements to their operation. Overwhelmingly, the two most requested data metrics were Daily Average Turn Times and Weekly Import Container Dwell Time. Both have been added to the new Dashboard with average turn times represented in minutes for single and double moves, for dry vans only, (i.e. refrigerated, HazMat, out of gauge shipments excluded). We have also added the number of trouble tickets and expect to add rail dwell soon.
If you are not yet receiving the weekly Port Supply Chain Dashboard and are interested in signing up, please email Elizabeth Langmaid at [email protected] to be added to the distribution list. We also encourage you to visit the Port Authority’s website to find additional resources on Port conditions and to subscribe to e-Alerts.